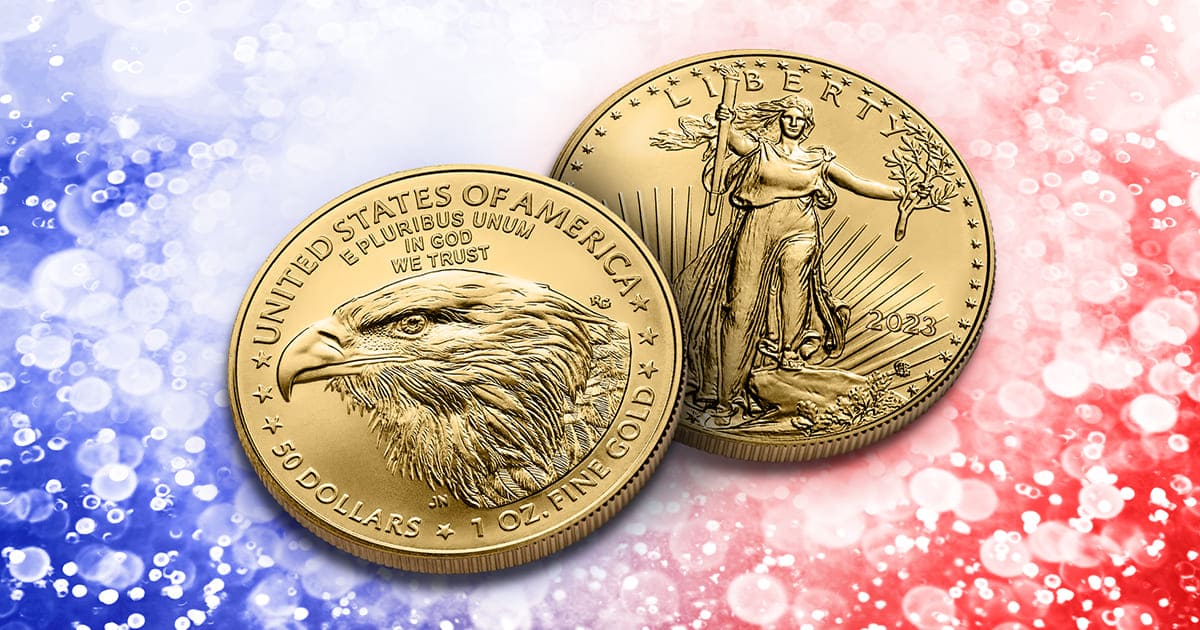
Since its inception in 1986, the American Gold Eagle coin has been a staple of United States Mint production. This gold bullion coin is recognized as legal tender and is famous worldwide. Gold Eagles come in four distinct denominations: 1 ounce ($50 face value), ½ ounce ($25 face value), ¼ ounce ($10 face value), and 1/10th ounce (with a $5 face value). These coins are produced at the Philadelphia Mint and West Point Mint and contain 91.67% gold, 3% silver, and 5.33% copper. It is not 100% gold because the silver-copper alloy strengthens the coin, which makes it harder to damage. People enjoy collecting Gold Eagles by year, denomination, or mint.
The obverse of American Gold Eagle coins bears the iconic 1907 Augustus Saint-Gaudens double gold eagle design. Since its launch, its reverse has displayed the “the family of eagles” design and the “the eagle profile.”
For more than three decades since its launch, the reverse design of the iconic Type 1 American Gold Eagle series remained the same. In 2021, Type 2 artwork of an up-close view of an American Bald Eagle that Jennie Norris illustrated replaced the depiction of a family of eagles.
Despite keeping the same Type 1 obverse design, its Type 2 version was slightly adjusted to improve aesthetics and safety. Revisions to the artwork included stars, a torch, and sun rays over Lady Liberty. Despite these changes, the gold purity and the coin’s size remain unchanged.
The American Gold Eagles are a great example of the U.S. government’s response to market demand, as they have crafted a stable and universally recognizable gold coin. Gold Eagle coins have become a cornerstone of the gold bullion market and are now widely sought-after among collectors and investors.
Gold Eagle Coin Mintage Chart
| Date | 1 oz | ½ oz | ¼ oz | 1/10 oz |
| 1986 | 1,362,650 | 599,566 | 726,031 | 912,609 |
| 1987 | 1,045,500 | 131,255 | 269,255 | 580,266 |
| 1988 | 465,500 | 45,000 | 49,000 | 159,500 |
| 1989 | 415,790 | 44,829 | 81,789 | 264,790 |
| 1990 | 373,210 | 31,000 | 41,000 | 210,210 |
| 1991 | 243,100 | 24,100 | 36,100 | 165,200 |
| 1992 | 275,000 | 54,404 | 59,546 | 209,300 |
| 1993 | 480,192 | 73,324 | 71,864 | 210,709 |
| 1994 | 221,663 | 62,400 | 72,650 | 206,380 |
| 1995 | 200,636 | 53,474 | 83,752 | 223,025 |
| 1996 | 189,148 | 39,287 | 60,318 | 401,964 |
| 1997 | 664,508 | 79,605 | 108,805 | 528,515 |
| 1998 | 1,468,530 | 169,029 | 309,829 | 1,344,520 |
| 1999 | 1,505,026 | 263,013 | 564,232 | 2,750,338 |
| 2000 | 433,319 | 79,287 | 128,964 | 569,147 |
| 2001 | 143,605 | 48,047 | 71,280 | 269,147 |
| 2002 | 222,029 | 70,027 | 62,027 | 230,027 |
| 2003 | 416,032 | 79,029 | 74,029 | 245,029 |
| 2004 | 417,019 | 98,040 | 72,014 | 250,016 |
| 2005 | 356,555 | 80,023 | 72,015 | 300,043 |
| 2006 | 237,510 | 66,005 | 60,004 | 285,006 |
| 2007 | 140,016 | 47,002 | 34,004 | 190,010 |
| 2008 | 710,000 | 61,000 | 70,000 | 305,000 |
| 2009 | 1,493,000 | 110,000 | 110,000 | 270,000 |
| 2010 | 1,125,000 | 81,000 | 86,000 | 435,000 |
| 2011 | 857,000 | 70,000 | 80,000 | 350,000 |
| 2012 | 675,000 | 43,000 | 90,000 | 290,000 |
| 2013 | 758,500 | 57,000 | 114,500 | 555,000 |
| 2014 | 425,000 | 35,000 | 90,000 | 545,000 |
| 2015 | 626,500 | 75,000 | 158,000 | 980,000 |
| 2016 | 817,500 | 74,000 | 152,000 | 925,000 |
| 2017 | 228,500 | 37,000 | 64,000 | 395,000 |
| 2018 | 191,000 | 32,000 | 62,000 | 230,000 |
| 2019 | 108,000 | 30,000 | 38,000 | 195,000 |
| 2020 | 747,500 | 70,000 | 106,000 | 350,000 |
| 2021 Type 1 | 456,500 | 31,000 | 56,000 | 150,000 |
| 2021 Type 2 | 665,500 | 65,000 | 108,000 | 350,000 |
| 2022 | 850,000 | 75,000 | 140,000 | 575,000 |
| 2023 | 921,500 | 102,000 | 198,000 | 670,000 |


