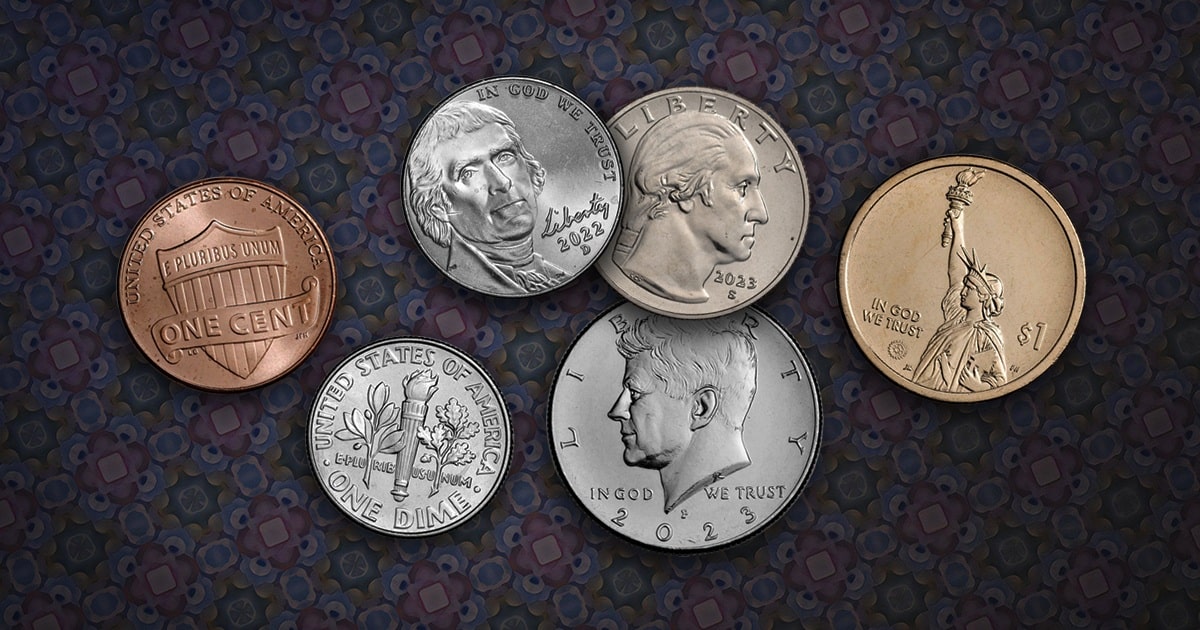
Some current U.S. coins have a cost associated with production that is greater than their face value. These are somewhat offset by coins that have a production cost below their face value per coin. This information is provided by the annual United States Mint report on the costs of minting circulating coins.
When seigniorage is lower than the exchange value, profit can be realized by minting and issuing coinage. Some coins cost more than others.
Can you guess which one is the most expensive to make?
Seigniorage by Coin Type and Per Dollar in 2023
Overall, the seigniorage per dollar issued across all denominations of circulating coins from the U.S. Mint was $0.26, a 4-cent decrease from 2022.
| Coin Type | Cost Per Coin | Total Seigniorage | Seigniorage per $1 Issued |
| Cent | $0.0307 | $86 Million | $2.08 |
| Nickel | $0.1154 | $92.6 Million | $1.31 |
| Dime | $0.0530 | $125.5 Million | $0.47 |
| Quarter | $0.1163 | $304 Million | $0.53 |
| Half Dollar | $0.2598 | $4.3 Million | $0.48 |
These costs cover everything from raw materials to facility costs, minting labor, and other direct costs. The cost of maintaining the intricate machinery and wages for skilled labor necessary to mint coins are also represented in these figures.
The raw material costs fluctuate based on market prices. The metals required to produce these coins are predominantly copper and nickel, although the cent is made from a copper coated zinc planchet.
What was the Total Seigniorage for 2023?
The total seigniorage reported by the United States Mint in 2023 was $249 million. That number is a 19.7% reduction from the previous year due to lower quarter, dime, and nickel volumes. In 2022, the Mint reported $310.2 million in seigniorage, which is the difference between production costs associated with producing a given currency and its face value. Those numbers are far under the operating budget of the U.S. Mint, which had a $3.4 billion budget in 2023.
What About Dollar Coins?
Although modern issues of dollar coins circulate with other current coins, they are not strictly considered circulation coinage or reported on in the same metrics as the cent through the half dollar.
A full breakdown of coins and currency would reveal that one-dollar bank notes cost $0.054 to produce. While that is almost half of the cost associated with producing one-dollar coins, the lifespans vary significantly. One-dollar coins have an average lifespan of 30 years, and one-dollar notes have an average lifespan of 6.6 years.
Revenue By Coin Type in 2023
Determining the revenue by coin type is paramount for an informed and accurate representation of cost breakdowns by fiscal year. All circulating coins issued in 2023 represent about $14.5 billion. The U.S. Mint issues financial costs and earnings reports annually.
| Coin Type | Revenue |
| Cent | $41.4 Million |
| Nickel | $70.8 Million |
| Dime | $266.6 Million |
| Quarter | $568.4 Million |
| Half Dollar | $8.9 Million |
Circulating Coinage Total Revenue by Year
| Year | Revenue |
| 2019 | $798.1 Million |
| 2020 | $1.1685 Billion |
| 2021 | $1.0440 Billion |
| 2022 | $1.0207 Billion |
| 2023 | $956.1 Million |
Revenue and Net Earnings by Bullion Coins
What about coins like Silver, Gold, and Platinum American Eagles? These costs will differ as the raw materials required to produce bullion coins carry a higher premium, which is built into the price per coin.
| Coin Type | Revenue | Net Income |
| Silver American Eagle | $548.5 Million | $16 Million |
| Gold American Eagle | $1,965.1 Million | $41.9 Million |
| Platinum American Eagle | $14.3 Million | $4.6 Million |
| Gold Buffalo | $738.1 Million | $16.2 Million |


